Total Holdings
28
As of Oct 4, 2026

YieldMax Universe Fund of Option Income ETFs
YMAXNYSEARCAYieldMaxEquity
As of Oct 26, 2026 close
Every listed position with its portfolio weight, plus sector breakdown and geographic exposure for this Equity ETF. Analyze fund diversification and concentration.
Distribution breakdown by sector, asset type, and geographic region. Understand the fund's diversification strategy across markets and asset classes.
Loading chart...
Holdings as of Oct 4, 2026. Ticker, name, asset type and portfolio weight for each position.
| # | Symbol | Name | Type | Weight |
|---|---|---|---|---|
| 1 | #MRNY | YieldMax MRNA Option Income Strategy ETF | Stock | 9.38% |
| 2 | #HOOY | YieldMax HOOD Option Income Strategy ETF | Stock | 7.25% |
| 3 | #AMDY | YieldMax AMD Option Income Strategy ETF | Stock | 6.86% |
| 4 | #FBY | YieldMax META Option Income Strategy ETF | Stock | 6.35% |
| 5 | #APLY | YieldMax AAPL Option Income Strategy ETF | Stock | 6.27% |
| 6 | NYSE ARCA:GDXY | YieldMax Gold Miners Option Income Strategy ETF (GDXY) | Cash | 5.72% |
| 7 | #GDXY | YieldMax Gold Miners Option Income Strategy ETF | Stock | 5.24% |
| 8 | NYSE ARCA:SMCY | YieldMax SMCI Option Income Strategy ETF | Cash | 5.20% |
| 9 | #TSLY | YieldMax TSLA Option Income Strategy ETF | Stock | 5.01% |
| 10 | NYSE ARCA:MSFO | YieldMax MSFT Option Income Strategy ETF | Cash | 4.96% |
| 11 |  | YieldMax AI & Tech Portfolio Option Income ETF | Cash | 4.89% |
| 12 |  | YieldMax PLTR Option Income Strategy ETF | Cash | 4.83% |
| 13 |  | Yieldmax XOM Option Income Strategy ETF | Cash | 4.77% |
| 14 |  | YieldMax SNOW Option Income Strategy ETF | Cash | 4.62% |
| 15 | #CONY | YieldMax COIN Option Income Strategy ETF | Stock | 4.54% |
| 16 | #CRCO | YieldMax CRCL Option Income Strategy ETF | Stock | 4.48% |
| 17 | NYSE ARCA:AMZY | YieldMax AMZN Option Income Strategy ETF | Cash | 4.44% |
| 18 | #SNOY | YieldMax SNOW Option Income Strategy ETF | Stock | 4.36% |
| 19 |  | YieldMax TSM Option Income Strategy ETF | Cash | 4.30% |
| 20 | #AIYY | YieldMax AI Option Income Strategy ETF | Stock | 4.25% |
| 21 | #LFGY | YieldMax Crypto Industry & Tech Portfolio Option Income ETF | Stock | 4.24% |
| 22 | NYSE ARCA:JPMO | YieldMax JPM Option Income Strategy ETF | Cash | 4.17% |
| 23 |  | YieldMax Ultra Option Income Strategy ETF | Cash | 3.92% |
| 24 | NYSE ARCA:OARK | Tidal Trust II - YieldMax Innovation Option Income Strategy ETF | Cash | 3.87% |
| 25 | #XOMO | YieldMax XOM Option Income Strategy ETF | Stock | 3.86% |
| 26 |  | Yieldmax MSTR Option Income Strategy ETF | Cash | 3.65% |
| 27 | NYSE ARCA:AIYY | Tidal Trust II YieldMax AI Opti | Cash | 3.60% |
| 28 |  | YieldMax XYZ Option Income Strategy ETF | Cash | 3.52% |
| 29 | #YBIT | YieldMax Bitcoin Option Income Strategy ETF | Stock | 3.52% |
| 30 |  | YieldMax S&P 500 0DTE Covered Call Strategy ETF | Cash | 3.51% |
| 31 | NYSE ARCA:NVDY | YieldMax NVDA Option Income Strategy ETF | Cash | 3.36% |
| 32 | #SLTY | YieldMax Ultra Short Option Income Strategy ETF | Stock | 3.33% |
| 33 |  | YieldMax Russell 2000 0DTE Covered Call Strategy ETF | Cash | 3.31% |
| 34 |  | YieldMax Nasdaq 100 0DTE Covered Call Strategy ETF | Cash | 3.25% |
| 35 |  | YieldMax Target 12 Big 50 Option Income ETF | Cash | 3.20% |
| 36 |  | YieldMax BABA Option Income Strategy ETF | Cash | 3.17% |
| 37 | #MARO | YieldMax MARA Option Income Strategy ETF | Stock | 3.14% |
| 38 | #YSPC | YieldMax SPCX Option Income Strategy ETF | Stock | 3.08% |
| 39 |  | YieldMax CRCL Option Income Strategy ETF | Cash | 2.94% |
| 40 | #YQQQ | YieldMax Short N100 Option Income Strategy ETF | Stock | 2.85% |
| 41 | #MSTY | YieldMax MSTR Option Income Strategy ETF | Stock | 2.78% |
| 42 |  | YieldMax Semiconductor Portfolio Option Income ETF | Cash | 2.67% |
| 43 | #RDYY | YieldMax RDDT Option Income Strategy ETF | Stock | 2.54% |
| 44 |  | Tidal Trust II | Stock | 2.37% |
| 45 | NYSE ARCA:PYPY | Yieldmax PYPL Option Income Strategy ETF | Cash | 1.99% |
| 46 | #DIPS | YieldMax Short NVDA Option Income Strategy ETF | Stock | 1.21% |
| 47 | 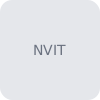 | Tidal Trust II - Yieldmax NVDA Performance And Income Target 25 ETF | Cash | 1.19% |
| 48 | #MINY | YieldMax Strategic Metals & Mining Portfolio Option Income ETF | Stock | 1.11% |
| 49 |  | YieldMax Target 12 Semiconductor Option Income ETF | Stock | 0.85% |
| 50 | #MSST | YieldMax MSTR Performance & Distribution Target 25 ETF | Stock | 0.82% |
| 51 | NMFQS:FGXXX | - | Cash | 0.58% |
| 52 | #TEST | YieldMax TSLA Performance & Distribution Target 25 ETF | Stock | 0.56% |
| 53 | 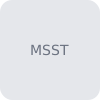 | Tidal Trust II - YieldMax MSTR Performance & Distribution Target 25 ETF | Cash | 0.17% |
Source: Fund holdings disclosures. Data as of Oct 4, 2026. Data sources and methodology
As of Oct 4, 2026, YieldMax Universe Fund of Option Income ETFs (YMAX) holds 28 securities. The largest are YieldMax MRNA Option Income Strategy ETF (9.38%), YieldMax HOOD Option Income Strategy ETF (7.25%), YieldMax AMD Option Income Strategy ETF (6.86%). The holdings table lists each position by portfolio weight with its ticker, name and asset type.
As of Oct 4, 2026, the 10 largest positions make up 62.2% of YMAX's assets. A concentrated portfolio has fewer large positions with higher individual weights, while a diversified portfolio distributes holdings more evenly.
The Sector Allocation chart shows how YMAX distributes investments across different industries like Technology, Healthcare, Financials, and more. This sector exposure helps understand the fund's industry diversification strategy.
YMAX's geographic exposure is shown in the Countries tab under Portfolio Allocations. This reveals the fund's international diversification and exposure to different regions and global markets.
YMAX's diversification can be assessed by reviewing its 28 holdings (as of Oct 4, 2026), sector allocation, and geographic exposure. A well-diversified ETF spreads investments across multiple securities, sectors, and regions to reduce concentration risk.